Visualize Tree Structure with PyGraphviz
The SegmentTree
Count the number within interval range.
def build(arr):
    # full binary tree represented by an array.
    # https://hg.python.org/cpython/file/2.7/Lib/heapq.py
    sz = 1
    while sz < len(arr):
        sz <<= 1

    # tree in this case will store the count of number in this range.
    tree = [0] * ((sz<<1)-1)

    return tree

def update(tree, idx, arr, start, end, val):
    tree[idx] += 1
    if start == end: return

    mid = (start+end) // 2
    if val <= arr[mid]:
        update(tree, idx*2+1, arr, start, mid, val)
    else:
        update(tree, idx*2+2, arr, mid+1, end, val)

def query(tree, idx, arr, start, end, val):
    # out of range
    if val < arr[start]:
        return 0
    if val >= arr[end]:
        return tree[idx]

    # leaf node
    if start == end:
        return tree[idx]

    mid = (start+end) // 2
    if val <= arr[mid]:
        return query(tree, idx*2+1, arr, start, mid, val)
    else:
        return tree[idx*2+1] + query(tree, idx*2+2, arr, mid+1, end, val)
The Graph
import pygraphviz

def build_nodes(nodes, tree, idx, arr, start, end):
    if start == end:
        #nodes[idx] = (idx, arr[end], tree[idx])
        nodes[idx] = "[%d] %d" % (arr[end], tree[idx])
        return

    nodes[idx] = "[%d..%d] %d" % (arr[start], arr[end], tree[idx])
    mid = (start+end) // 2
    build_nodes(nodes, tree, idx*2+1, arr, start, mid)
    build_nodes(nodes, tree, idx*2+2, arr, mid+1, end)

def get_graphviz_agraph(tree, arr, leaf_same_level=False):
    # XXX: do not use networkx.DiGraph, because it cannot
    # gurrentee the order.
    # https://networkx.github.io/documentation/networkx-1.9/_modules/networkx/drawing/nx_agraph.html#to_agraph
    G = pygraphviz.AGraph(directed=True)
    G.graph_attr["rankdir"] = "TB"
    G.graph_attr["splines"] = "ortho"
    # http://www.graphviz.org/content/attrs#dordering
    G.graph_attr["ordering"] = "out"
    G.layout(prog='dot')

    nodes = {}
    build_nodes(nodes, tree, 0, arr, 0, len(arr)-1)
    keys = sorted(nodes.keys())
    for key in keys:
        G.add_node(nodes[key], shape='box', color="blue")

    for i in range(len(tree)//2):
        if i*2+1 in nodes:
            G.add_edge(nodes[i], nodes[i*2+1], color='red', style='dashed')
        if i*2+2 in nodes:
            G.add_edge(nodes[i], nodes[i*2+2], color='black', style='dashed')

    if leaf_same_level:
        # http://stackoverflow.com/questions/22207802/pygraphviz-networkx-set-node-level-or-layer/22214653#22214653
        G.add_subgraph([node for node in G.nodes() if ".."not in node], rank="same")

    return G
The Visualization
# http://python-future.org/compatible_idioms.html#stringio
#from StringIO import StringIO
from io import BytesIO
from IPython.display import Image, display
def display_graph(G):
# https://github.com/chebee7i/nxpd/blob/master/nxpd/ipythonsupport.py
imgbuf = BytesIO()
G.draw(imgbuf, format='png', prog='dot')
img = Image(imgbuf.getvalue())
display(img)
if __name__ == "__main__":
import random
random.seed(10)
nums = [random.randint(1, 100) for _ in range(24)]
nums_sorted = list(sorted(set(nums)))
tree = build(nums_sorted)
for n in nums:
update(tree, 0, nums_sorted, 0, len(nums_sorted)-1, n)
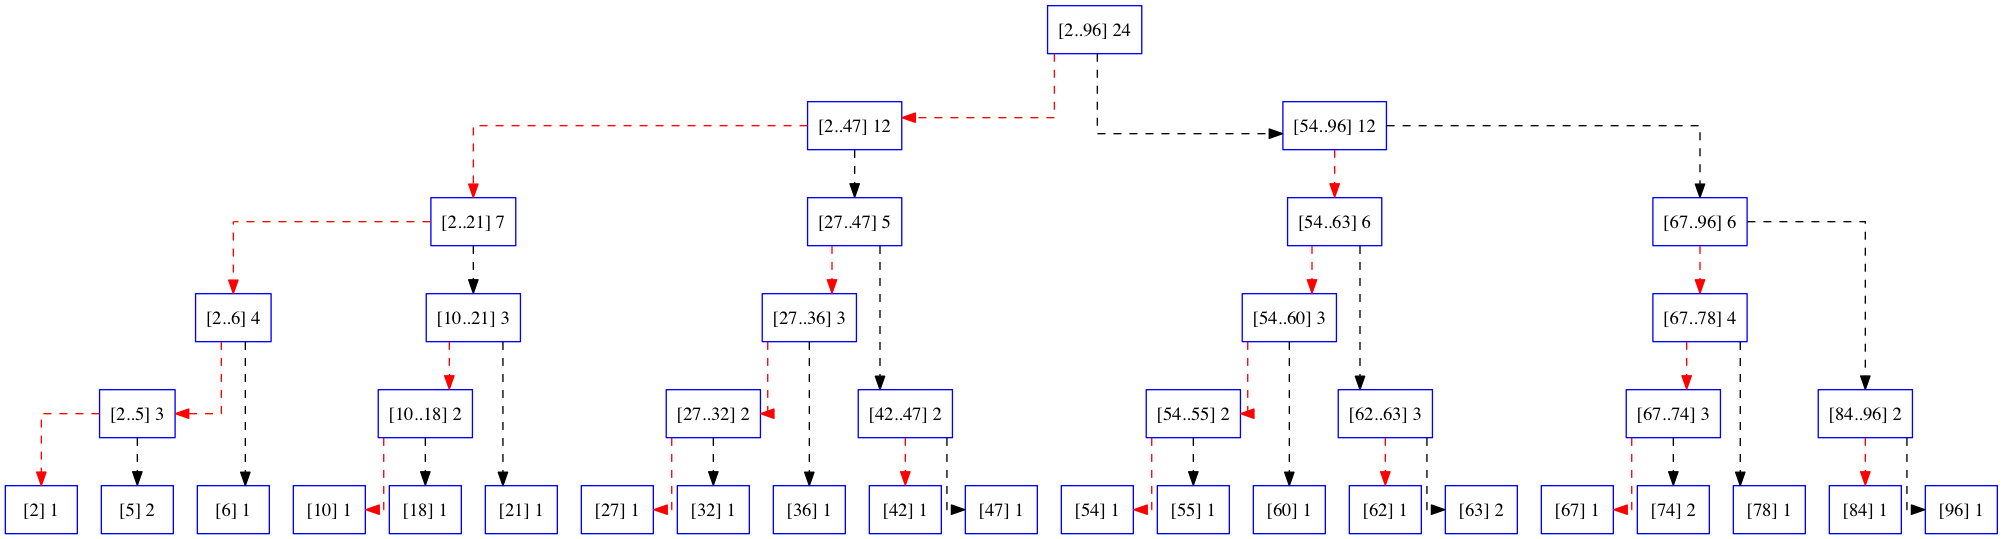
G = get_graphviz_agraph(tree, nums_sorted)
display_graph(G) # G1
G = get_graphviz_agraph(tree, nums_sorted, leaf_same_level=True)
display_graph(G) # G2
- G1
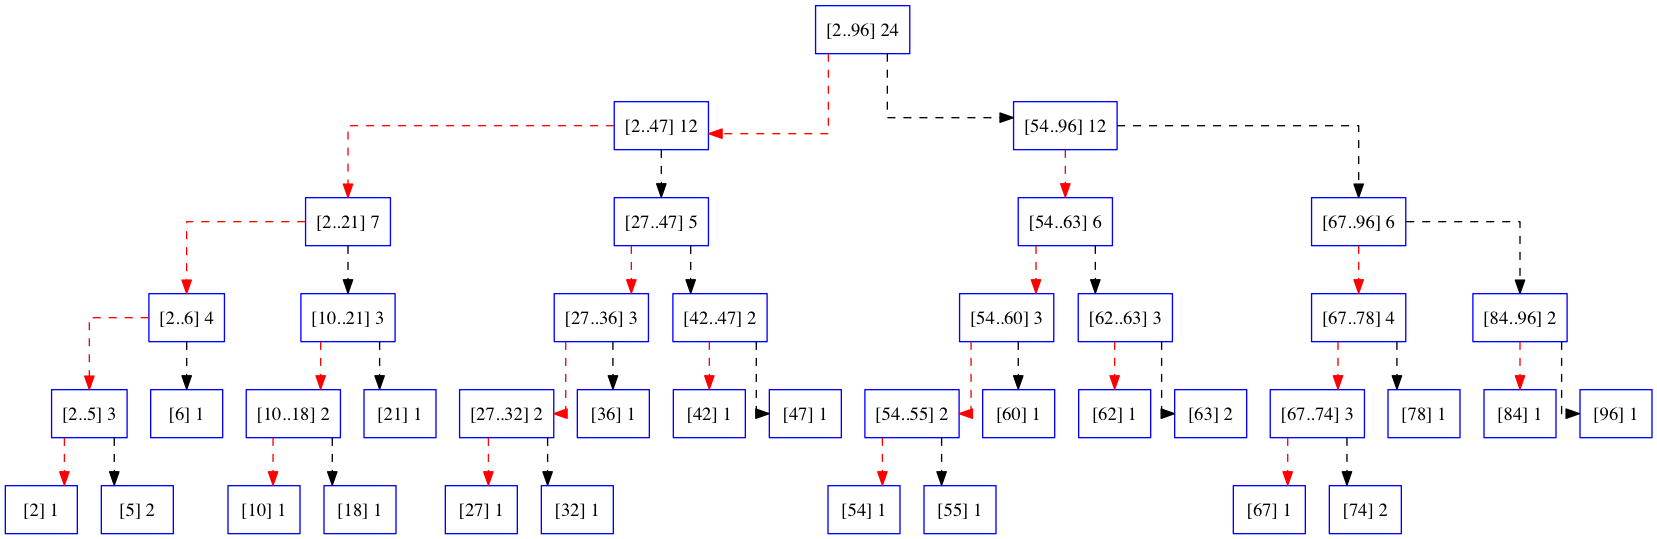
- G2